jqplot
in Programming on jQuery
jQuery
You can have so many plugin for JQuery.
jqplot help you to make a chart quickly.

http://www.jqplot.com/download/
as you see, you can make chart simply with example source & docs. 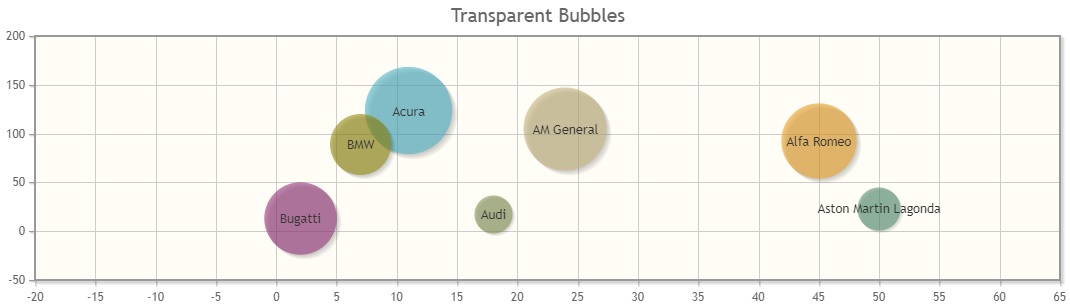
<!DOCTYPE html>
<html>
<head>
<meta charset="utf-8">
<title>Insert title here</title>
    <script type="text/ecmascript" src="/jquery/jquery-1.12.4.min.js"></script>
    <script type="text/ecmascript" src="/jquery/jqplot/jquery.jqplot.min.js"></script>
    <script type="text/ecmascript" src="/jquery/jqplot/excanvas.js"></script>
    <!-- barchar graph -->
    <script class="include" language="javascript" type="text/javascript" src="/jquery/jqplot/plugins/jqplot.barRenderer.js"></script>
    <script class="include" language="javascript" type="text/javascript" src="/jquery/jqplot/plugins/jqplot.categoryAxisRenderer.js"></script>
   	<script class="include" type="text/javascript" src="/jquery/jqplot/plugins/jqplot.bubbleRenderer.js"></script>
    <link rel="stylesheet" type="text/css" href="/jquery/jqplot/jquery.jqplot.min.css" />


    <script type="text/javascript">
        $(function () {
        	$(document).ready(function(){

        	    var arr = [[11, 123, 1236, "Acura"], [45, 92, 1067, "Alfa Romeo"],
        	    [24, 104, 1176, "AM General"], [50, 23, 610, "Aston Martin Lagonda"],
        	    [18, 17, 539, "Audi"], [7, 89, 864, "BMW"], [2, 13, 1026, "Bugatti"]];

        	    plot1 = $.jqplot('chartLayer',[arr],{
        	        title: 'Transparent Bubbles',
        	        seriesDefaults:{
        	            renderer: $.jqplot.BubbleRenderer,
        	            rendererOptions: {
        	                bubbleAlpha: 0.6,
        	                highlightAlpha: 0.8
        	            },
        	            shadow: true,
        	            shadowAlpha: 0.05
        	        }
        	    });
        	});
        });
   	 </script>
</head>
<body>
	<div id="chartLayer"></div>
</body>
</html>